Paid media now takes 30.6% of the average marketing budget, and that media price inflation means CMOs are getting less for every dollar spent.
The problem is most CMOs prioritize channels through revenue. What this means is if a channel offers higher revenue, it gets a large chunk of the marketing budget.
But a sale is not profit. Discounts, returns, shipping, payment fees, and ad costs all land after the order, and they land unevenly by channel.
This guide shows you how to calculate contribution margin by channel, so you can see which sales pay you and which ones quietly cost you.
Key Action Points
- Calculate contribution margin for your top three channels before you raise any ad budget.
- Stop reading ROAS as a profit number. Convert it to break-even ROAS first.
- Track discounts and refunds by the channel that created the order.
- Cap any channel that stays below your margin floor after 60 days.
- Measure repeat rate by first-touch channel before you fund a negative-margin channel.

What is Contribution Margin by Channel?
Contribution margin isn’t net profit. It’s what a sale leaves after every cost that moves with that sale. Rent and salaries stay out.
Product cost, shipping, fees, discounts, returns, and channel spend stay in.
Contribution margin = net revenue minus product cost, fulfillment, payment fees, returns, and channel cost.
Run it by channel, and Shopify’s blended number breaks apart. The channel with the most revenue is rarely the channel with the most margin.
Why Revenue by Channel Misleads Shopify Store Owners?
Shopify reports sales by source. Ad platforms report ROAS inside their own walls. Neither tells you what’s left after the order ships.
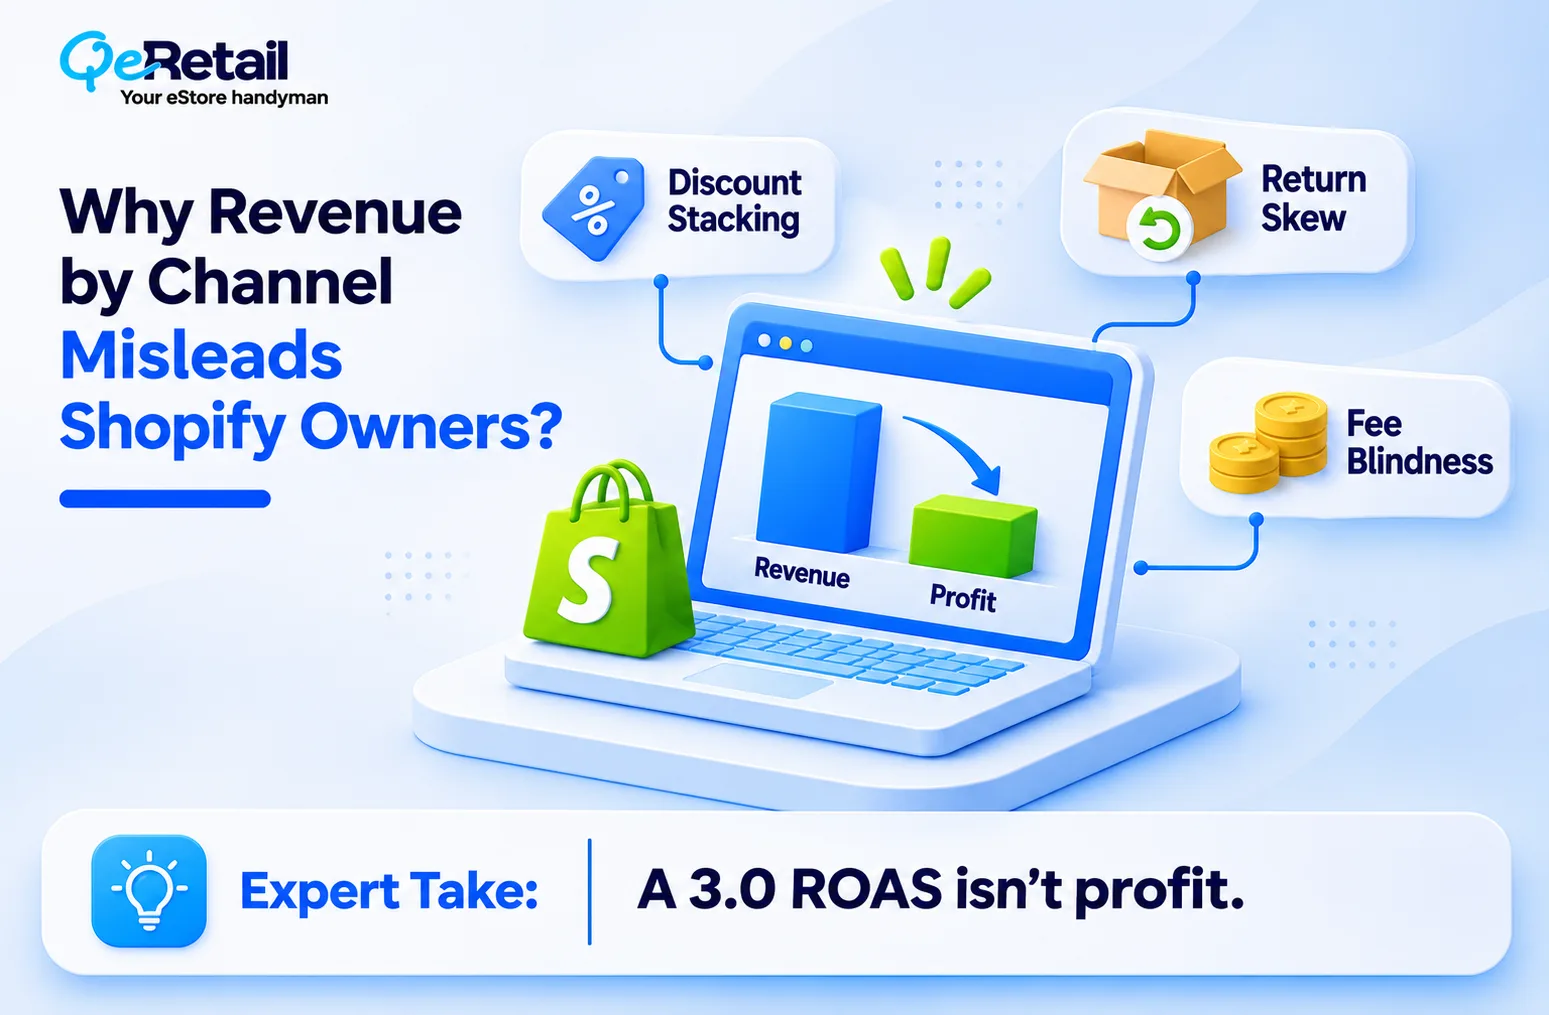
Three leaks hide in that gap:
- Discount stacking: influencer codes and welcome offers cut the price on orders that already carry ad cost.
- Return skew: impulse-driven channels send back more product, so revenue reverses after your dashboard counted it.
- Fee blindness: marketplace commissions and affiliate payouts sit outside the numbers most owners check daily.
The pressure is building, too. Deloitte’s 2026 retail outlook finds that 40% of consumers now show deal-driven or cost-conscious habits. More shoppers hunting for a code means more margin leaking at the channel level.
Expert Take:
A 3.0 ROAS is not a profit signal. At a 40% product cost, a 3.0 ROAS spends 33% of revenue on ads and leaves 27% before shipping, fees, and returns. Those three often eat most of what remains.
The Four-Step Channel Margin Calculation
You don’t need new software. You need a clean spreadsheet, and one attribution rule you keep for 90 days.
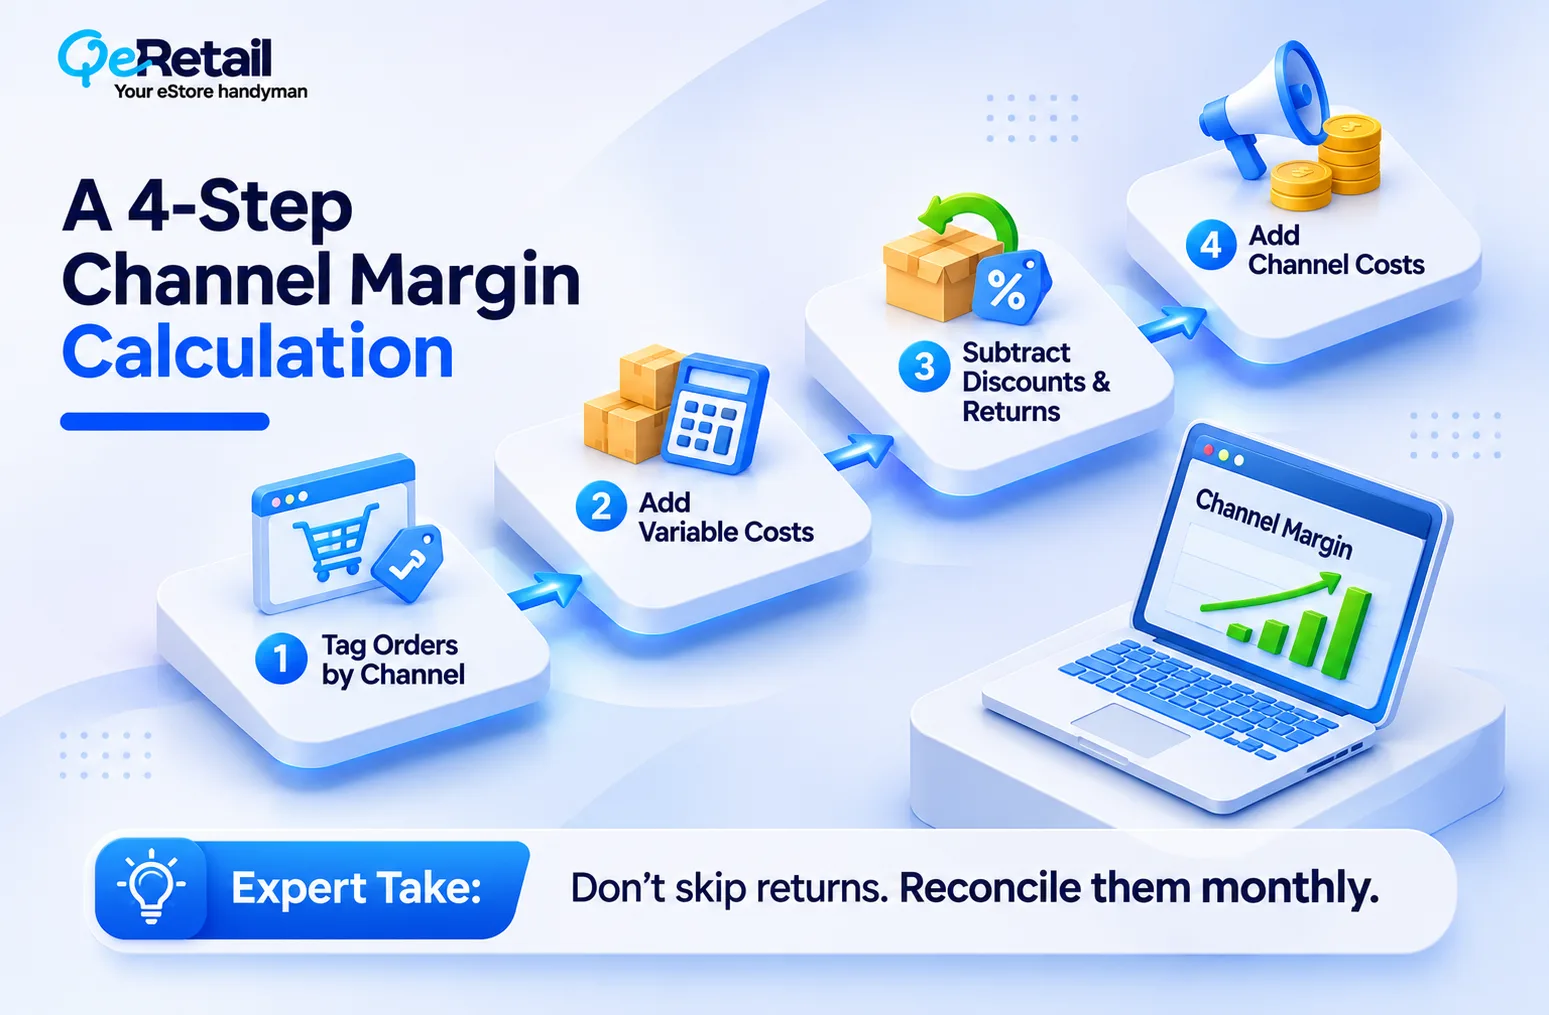
1. Tag every order by channel: Use UTMs, Shopify’s order source, and discount code mapping. Pick one rule (last non-direct click works) and stop changing it.
2. Load variable costs per order: Landed product cost, pick and pack, shipping net of what the customer paid, and payment processing.
3. Subtract discounts and returns by channel: Map each refund back to the original order source, not the refund date.
4. Add the channel’s own cost: Ad spend, commissions, affiliate payouts, and any app fee tied to that channel.
Where does each number live?
Orders and discount codes sit in your Shopify order export. Refunds sit in the same export, linked by order ID.
Payment fees come from your payout reports, ad spend from each ad platform, and commissions from your affiliate or influencer dashboard. Merge everything on order ID or channel and month. That’s the whole model.
Expert Take:
Returns are the step owners skip, because they arrive weeks late. Skip them and your best-looking channel can be your worst. Reconcile refunds monthly against the original order.
Which Channels Usually Pay and Which Quietly Bleed?
Here is an illustrative example per $10,000 in sales. These are not benchmarks. Replace them with your own numbers.
| Channel | Product Cost | Fulfillment and Fees | Discounts and Returns | Channel Cost | Contribution Margin
|
|---|---|---|---|---|---|
| Email and SMS | $4,000 | $1,100 | $1,200 | $400 | $3,300 (33%) |
| Google Branded Search | $4,000 | $1,100 | $1,000 | $1,500 | $2,400 (24%) |
| Influencer Codes | $4,000 | $1,100 | $2,000 | $1,800 | $1,100 (11%) |
| Meta Prospecting | $4,000 | $1,100 | $1,800 | $3,500 | -$400 (-4%) |
Email wins because it carries almost no media cost. But it only works on a list other channels built. Branded search looks efficient because it captures demand that already existed. Influencer codes look cheap until the discount and the payout stack.
Branded search margin is borrowed credit. Many of those shoppers met you on Meta, email, or an influencer post, then searched your name to finish the order. Pause branded ads for two weeks on a test basis before you decide whether that 24% is real or just credit stolen from another channel.
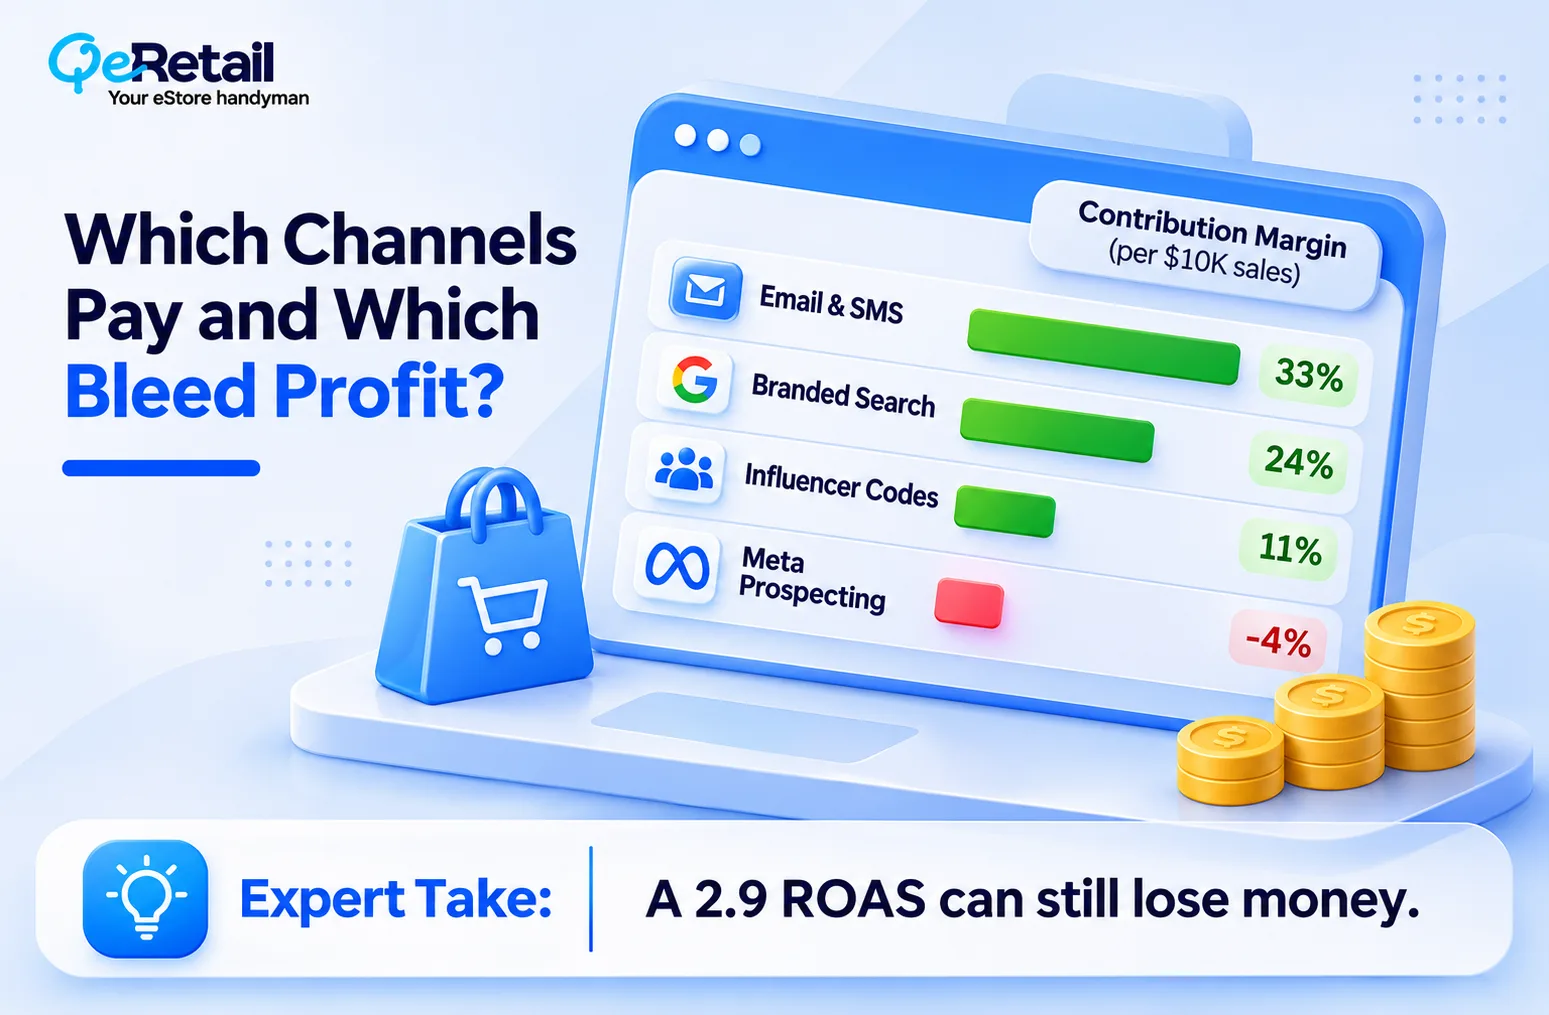
Meta prospecting is the uncomfortable row. A 2.9 ROAS looks healthy on the ad platform, yet the first order loses money. A negative first-order margin is not automatically a bad channel. It’s a loan. Meta at minus 4% only makes sense if those buyers reorder and your email flows repay the loan inside your payback window.
If you haven’t measured repeat rate by channel, you aren’t investing. You’re guessing. Pair this with a plan to reduce your Shopify customer acquisition cost, because lower CAC is the fastest way to lift a thin channel.

Where to Start at Each Revenue Tier?
- $100K to $200K: Build the table for your top three channels, once a month. Cap any channel that stays under 10% contribution margin.
- $200K to $400K: Add repeat rate by first channel. Give negative-margin channels a 60 to 90-day payback window, and move influencer discounts to unique, expiring offers.
- $400K to $500K+: Run a weekly channel P&L. Split marketplaces from your own store, and review SKU mix by channel, because product cost differs by where the sale happens.
Email carries the most margin in all three tiers, so strengthen the MOFU layer of your funnel before you push more paid traffic.
Conclusion
If your channel report ranks sources by revenue, you didn’t build a channel strategy. You built a leaderboard.
Contribution margin by channel changes the question from “what sells most?” to “what pays most?” That answer tells you where to scale, where to cap, where to fix, and where to walk away. Stores that make this shift stop funding growth that never comes back as cash.
They also negotiate better, because they know exactly how much discount, commission, or ad cost a channel can absorb before it stops paying.
Need a partner who rebuilds your channel reporting around margin, not sales?
QeRetail can run that audit with you. Book a free consultation now.
Frequently Asked Questions
What is Contribution Margin in Shopify?
How Do I Calculate Break-Even ROAS From Contribution Margin?
What Is a Good Contribution Margin for a Shopify Store?
Should I Stop a Channel With Negative Contribution Margin?
How Long Does This Take, and Can a Small Team Do It?
Table of Contents